Uncertified Teachers in Texas
In 2025–26, 11.9% of Texas teachers held no active certificate, up from 3.9% in 2020–21. That is roughly 41,500 uncertified teachers statewide across traditional districts and charters.
1. Policy context
Texas constitutes a long-term education case study in deregulation, local control, and innovative practices; it is a significant one, given the size of the state.
In 2015, a controversial development came in the form of “Districts of Innovation.” Districts with at least an “acceptable” rating could adopt an innovation plan and claim exemptions from state policies from which charter schools are exempt, including ones pertaining to certification, school calendars, and class sizes.1,2 Districts also no longer had to inform parents if their children were being taught by uncertified teachers.3 An uncertified teacher in Texas is one who does not hold an active State Board for Educator Certification (SBEC) credential. In 2020, 740 districts (out of 1,025) were Districts of Innovation.4 Currently, that number has grown to 977.5 Much of this increase can be attributed to challenges during and after the COVID-19 pandemic, which saw record levels of teacher resignations.6 The rate of Texas teachers leaving the profession is now at 12%, as compared to the national average of 7–8%.7
In 2025, the legislature passed HB 2, reversing this deregulation of teacher certification. Uncertified teachers are banned from acting as the “teacher of record” for foundation curriculum (reading, math, social studies, and science) starting in the 2027–2028 school year; the commissioner can approve delays until the 2029–2030 school year. Districts of Innovation are no longer exempt from notifying parents. A pay premium for certified new teachers was added.8
Crucially, HB 2’s ban does not apply to charter schools,9 where 54% of teachers are uncertified.10
Other states vary: Tennessee11 and Oklahoma12 are restricting uncertified teachers, while Arkansas,13 Arizona,14 Florida,15 Utah,16 and Kansas17 lowered barriers to entry.
2. What the data show
Exposure over time
Overall, the share of uncertified teachers increased in both charter schools and traditional public schools between the 2020–2021 school year and the 2025–2026 school year. Figure 1 shows these trends disaggregated by school type, because charter districts already relied on uncertified teachers prior to 2020. The percentage in traditional districts rose from 2.0% to 8.6% (with the peak at 8.8% in 2024–25); the percentage in charter schools rose from 34.6% to 54.0%. In traditional public schools, these increases occurred across geographic regions and poverty levels, although there were different patterns in distribution of growth depending on both metrics.
Who is exposed
Figure 2 graphs the percentage of uncertified teachers across poverty quintiles, with Q1 being the lowest-poverty quintile, and Q5 the highest. In 2025–26, the share of uncertified teachers in Q1 was 4.0%. In Q4, it was 13.6%, and in Q5, it was 11.2%.
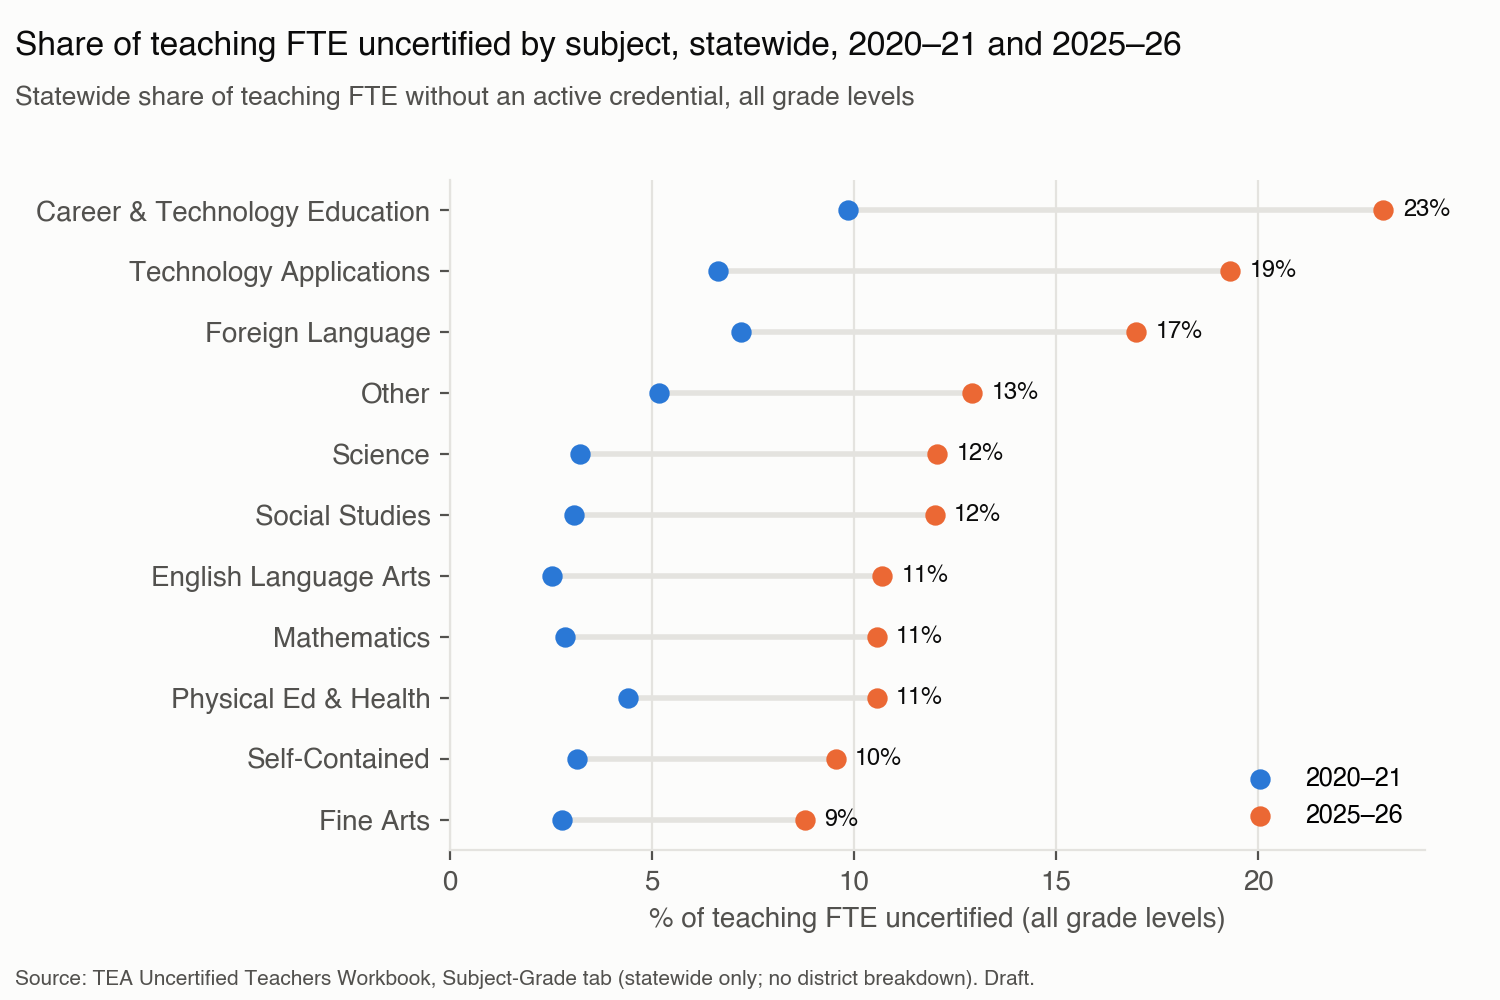
Statewide concentration of uncertified teachers by subject and grade band. Source: TEA (statewide only).
Relative increase
Figure 4 shows how the percentage of uncertified teachers grew in relation to poverty level and geographic locale. In cities, this growth increases sharply with poverty (+221% in Q1 to +761% and +777% in Q4 and Q5, respectively). For suburbs, the highest percent growth falls in Q4 (+693%), Q3 (+534%), and Q2 (+429%), although these quintiles contain fewer districts. In towns, the percent increase is relatively flat across poverty quintiles, with the highest percent change occurring for Q2 (+384%). In rural districts, the percent increase falls as poverty rises (+288% in Q1 to +144% in Q5).
Geography
District map and education service regions (Figures 7 and 8).
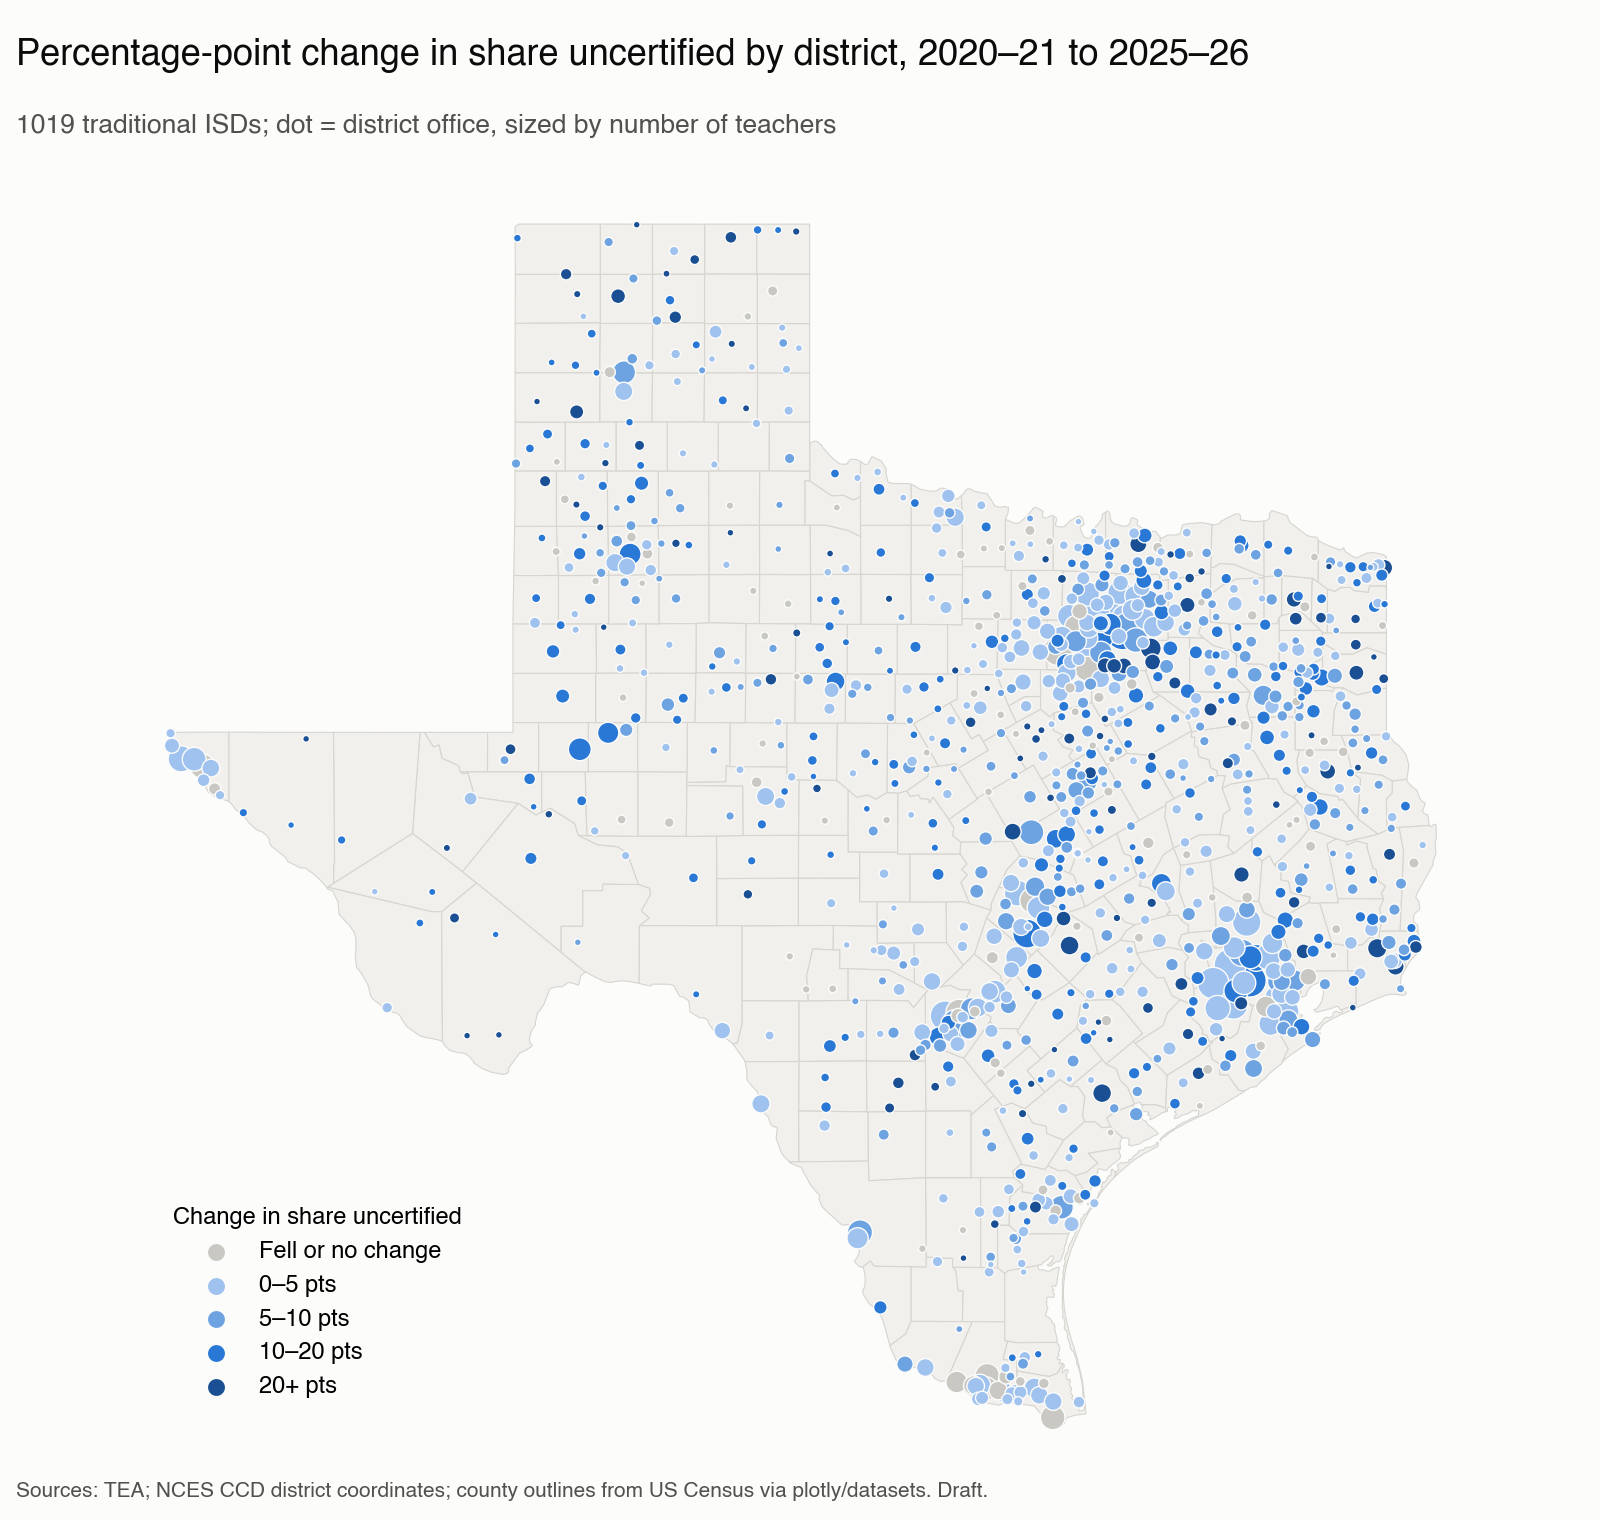
Percentage-point change by district, 2020–21 to 2025–26. Percent change can’t be computed for districts that started at zero, so the map uses points. Sources: TEA, NCES CCD coordinates, Census county outlines.
Districts beating the odds
PreliminaryBright spot analysis identified 40 districts in the top third of exposure (i.e., 12.0% or more of teachers uncertified) whose student growth was higher than predicted in every year observed (Figure 9, Table 2). Of the 40 districts, 65% were rural, and 65% were in poverty quintiles Q4 or Q5.
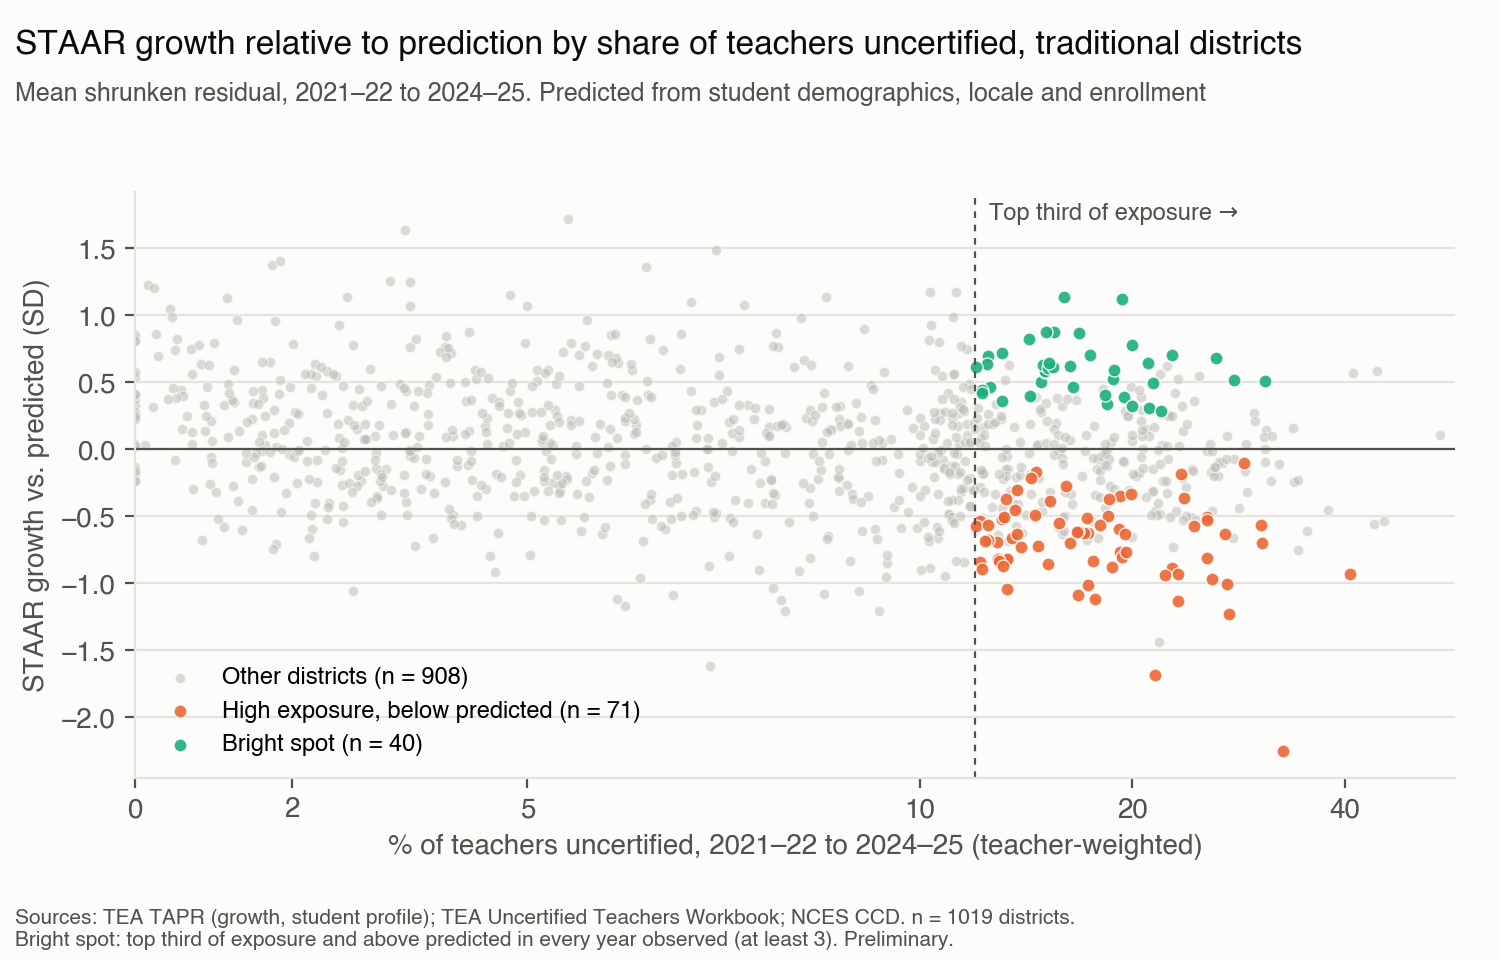
STAAR growth relative to prediction by share of teachers uncertified, traditional districts, 2021–22 to 2024–25. Prediction from student demographics, locale and enrollment; residuals shrunk for small districts. Sources: TEA TAPR; TEA Uncertified Teachers Workbook; NCES CCD.
| Bright spots | High exposure, below predicted | High exposure, all | Low exposure | All traditional | |
|---|---|---|---|---|---|
| Districts (n) | 40 | 71 | 341 | 340 | 1,019 |
| Share of teachers uncertified (%) | 17.4 | 18.6 | 19.3 | 2.9 | 10.3 |
| STAAR growth vs. predicted (SD) | 0.60 | −0.70 | −0.14 | 0.15 | −0.00 |
| Enrollment (median) | 977 | 1,090 | 634 | 1,940 | 993 |
| Rural (%) | 65 | 66 | 72 | 55 | 68 |
| Town (%) | 32 | 20 | 21 | 10 | 15 |
| City or suburb (%) | 2 | 14 | 7 | 35 | 17 |
| Economically disadvantaged students (%) | 70.6 | 68.4 | 68.4 | 51.3 | 59.8 |
| Emergent bilingual students (%) | 13.3 | 15.4 | 12.2 | 13.2 | 11.9 |
| Special education students (%) | 15.8 | 13.6 | 14.7 | 14.0 | 14.6 |
| Teacher experience (avg. years) | 12.8 | 11.1 | 11.5 | 13.1 | 12.4 |
| Teacher tenure in district (avg. years) | 7.2 | 5.8 | 5.8 | 7.1 | 6.4 |
| Beginning teachers (%) | 8.1 | 12.7 | 12.1 | 5.8 | 8.9 |
| Teacher turnover rate (%) | 21.6 | 27.4 | 25.4 | 17.1 | 21.3 |
| Average teacher base salary ($) | 52,858 | 55,151 | 54,157 | 59,043 | 56,390 |
Characteristics of bright-spot and comparison districts. Unweighted means of each district’s 2021–22 to 2024–25 average; enrollment is the median. High exposure = top third of the share of teachers uncertified. Sources: TEA TAPR; TEA Uncertified Teachers Workbook; NCES CCD.
3. What district plans say
- How plans frame certification
- Safeguards promised vs. specified (Figure 10) Coding in progress
- Bright spots compared with other districts (Table 3) Coding in progress
4. Recommendations
To follow the completed analysis.
About the data
District counts come from TEA’s Uncertified Teachers Workbook (2020–21 to 2025–26), linked to NCES locale codes and Census child-poverty estimates for 1,213 districts and charters. Shares are teacher-weighted. These are district patterns, not causal estimates, and district averages do not show which students had uncertified teachers.
Sources
- Cedar Hill Independent School District. (n.d.). District of Innovation FAQ. https://www.chisd.net/our-district-story/district-of-innovation/district-of-innovation-faq
- Cunningham, A. (2016, Fall). What you need to know about Districts of Innovation. ATPE News. https://atpe.org/news-ax1pzuo5/atpe-news-magazine/atpe-news-archive/atpe-news-fall-2016/what-you-need-to-know-about-districts-of-innovation
- Tooley, M. (2026, September 30). Texas’s path to HB 2: Looking to past teacher certification policies to move forward. New America. https://www.newamerica.org/insights/texas-hb-2-teacher-certification-reforms/
- Author, year and title to add Texas ScholarWorks, University of Texas at Austin. https://repositories.lib.utexas.edu/items/1df1bd4d-4251-46e6-a6d4-5690b5add731
- Texas Education Agency. (n.d.). Districts of Innovation. https://legacycms.tea.texas.gov/texas-schools/district-initiatives/districts-of-innovation
- Charles Butt Foundation. (2021). 2021: How Texas teachers experience pandemic challenges. https://charlesbuttfdn.org/wp-content/uploads/2022/01/2021_How-Texas-Teachers-Experience-Pandemic-Challenges.pdf
- Davis, E. (2026, June 2). Texas public school teachers are leaving the profession at a higher rate than the national norm. Spectrum News. https://spectrumlocalnews.com/tx/south-texas-el-paso/news/2026/06/02/texas-public-school-teachers-are-leaving-the-profession-at-a-higher-rate-than-the-national-norm
- H.B. 2, 89th Leg., Reg. Sess. (Tex. 2025) (enrolled). https://capitol.texas.gov/tlodocs/89R/billtext/html/HB00002F.htm
- Texas Education Agency. (2025, October 16). HB 2 implementation: New teacher certification requirements update [To the Administrator Addressed letter]. https://tea.texas.gov/taa-letters/hb-2-implementation-new-teacher-certification-requirements-update
- Ibarra, D. (2026, August 25). Texas charter school teachers are nearly 7 times as likely to be uncertified, TEA data shows. KSAT. https://www.ksat.com/news/ksat-investigates/2026/08/25/texas-charter-school-teachers-are-nearly-7-times-as-likely-to-be-uncertified-tea-data-shows/
- Tenn. Pub. Acts, ch. 328 (114th Gen. Assemb.). Bill number and year to confirm https://publications.tnsosfiles.com/acts/114/pub/pc0328.pdf
- H.B. 4427, 60th Leg., 2d Sess. (Okla. 2026) (enrolled). https://www.oklegislature.gov/cf_pdf/2025-26%20ENR/hB/HB4427%20ENR.PDF
- Arkansas Department of Education. (2020). Act 1240 waivers and Acts 641 and 815 of 2019 [Presentation to the Arkansas Legislature]. https://arkleg.state.ar.us/Home/FTPDocument?path=%2FAssembly%2FMeeting+Attachments%2F040%2F3349%2FD.07h+ADE+DESE+Act+1240+Waivers+and+Acts+641+and+815+of+2019.pdf
- S.B. 1159, 55th Leg., 2d Reg. Sess., ch. 337 (Ariz. 2022). https://azleg.gov/legtext/55leg/2R/laws/0337.htm
- CS/S.B. 896, ch. 2022-186, Laws of Fla. (2022). https://www.flsenate.gov/Session/Bill/2022/896
- H.B. 208, Teacher Licensure Amendments, 2024 Gen. Sess. (Utah 2024). https://le.utah.gov/~2024/bills/static/HB0208.html
- Kansas makes modified emergency substitute teacher license permanent. (2025, June 24). Topeka Capital-Journal. Author to add https://www.cjonline.com/story/news/education/2025/06/24/kansas-makes-modified-emergency-substitute-teacher-license-permanent/84133126007/